
Research commentary
An unreasonable amount of my thinking about quantitative research happens in traffic on the MacArthur Causeway. I live in Wynwood and work with a startup hedge fund in Miami Beach. Between the drive over and the drive back, my mind keeps working on the same questions: what am I missing, what could work better, and am I improving this system or just making it more complicated? Miami supplies plenty of time to consider all three.
A dear friend who studied economics at MIT introduced me to the fund. I came in as a contractor and quantitative research engineer. We were starting without an established research infrastructure, working at a modest scale. High-frequency trading wasn’t the assignment. We needed a useful way to understand the market and build from there.
I brought Regime Analytics, a project I’ve been developing for a couple of years, and an approach: look at the environment around a trade before getting too excited about the trade itself. Market regime detection is how I organize that environment into recognizable states using measures such as trend, breadth and relative strength. Regime Analytics connects those states across the market, sectors and individual securities, giving quantitative researchers context for strategy development and risk decisions.
The fund gave that work a concrete setting. Other people needed to use it. They needed daily updates, a dashboard they could read and access through custom AI agents. Someone might care about a sector, someone else an industry or an individual stock, and someone else the overall market. They needed to connect those views without having to digest everything at once.
There was plenty of head-banging. The project also followed me home, into the thoughts that kept me awake, and up to Ocala when I went to help my parents fix their swimming pool. Some of the ideas that shaped it came from that pool, rather than a financial chart.
A green day can be very persuasive
You get two or three bullish days in a difficult market. A little tickle in the belly. Perhaps that was the bottom. Perhaps this is the moment to go all in.
That feeling is exactly why I want a consistent reference outside my own excitement. A recovery in prices can begin before the wider evidence improves. The question is whether participation, leadership and other conditions support what I’m seeing, and how much confidence to place in it.
It’s tempting to summarize a divided market as “AI is booming and everything else is in a recession.” That goes further than the evidence. In its October 19, 2026 analysis, FactSet estimated Q3 earnings growth of 33.2% for the Magnificent Seven and 27.7% for the other 493 S&P 500 companies. Those are aggregate earnings figures, including estimates, rather than a measure of every company’s health or of stock-price participation. They do show why the recession shorthand is too broad.
The more useful question is what the headline conceals. Which parts of the market are participating? Which are recovering, and which are still deteriorating? A stock, its industry and the index can be telling quite different stories.
Our workflow uses the regime reading as a reference for those conversations. A few strong sessions don’t automatically erase a defensive classification. We can inspect the inputs and what would have to change, rather than changing our entire interpretation because the screen has turned green.
That matters for both strategy research and risk decisions. Preserving capital matters to me as much as finding opportunities. The purpose is to make those decisions with a broader, consistent set of observations; the portfolio decisions still belong to us.
The box around the box
My boxes-inside-boxes instinct goes back further than finance. In the 1990s, when I was learning to build websites, I used HTML tables inside other tables. Content inside content inside content. It was a very literal education in how one part of a layout depended on another.
I see related questions in graphic design and photography: how an element sits within a composition, how the surrounding space changes what you notice. Those experiences don’t prove a market hypothesis, but they influence which questions occur to me. The same habit makes mathematics less intimidating. I take the smallest expression I can work through, substitute some numbers, understand the operation, and then move outward. Greek notation used to scare the hell out of me. Breaking an expression into manageable pieces gives me somewhere to start. Eventually I still have to understand how the whole thing fits together.
In markets, a company belongs to an industry. The industry sits inside a sector, which operates within a wider economy. Interest rates, credit conditions and developments elsewhere in the world can reach into all of them. The boundaries are useful for thinking, but they aren’t walls.
Weather gives me a way to explain it. A tree moves in a gust of wind. To understand that gust, you might look at the buildings around it, the local conditions and the larger weather system moving through. Atmospheric science studies processes at these different scales, from local turbulence to regional storms and global circulation. UCAR’s introduction to weather follows that progression from local to regional to global.
Markets make me ask a similar question: what is happening around the thing I’m measuring? An individual stock, its peers and the broader market can be moving in different directions. Even when they’re all rising, the relationships between them can tell a different story from the headline index. A strong stock in a weak sector asks different questions of me than a strong stock moving with nearly everything else.
This is an analogy for how I approach the problem, rather than a claim that markets obey the laws of weather. People change their behavior, discover strategies and crowd into them. Relationships that were useful can weaken or reverse. That makes context worth measuring and worth testing again.
In statistical terms, the question is conditional: does knowing the surrounding state improve our estimate of what happens next? It is the difference between asking what usually follows a signal and asking what usually follows it under these conditions. The extra context earns its place when it improves the result on data the model wasn’t fitted to.
How I got here
My route into this wasn’t a mathematics PhD. It included creative work, private equity, and using data to understand distressed businesses, including their marketing, operations and infrastructure. In that work, fixing an isolated metric was rarely the whole assignment. I wanted to understand what was producing it and what else would move if we changed something.
Perhaps some of my neurospiciness contributes to that habit. I make connections between things that don’t initially look related. That’s useful for generating a hypothesis. The hypothesis still has to survive contact with the data.
Readers who’ve followed my Z-score indicator work will recognize the progression. An indicator gives you something specific to measure. The temptation is to let that one measurement answer a much larger question.
A statistically unusual price is interesting. It doesn’t arrive with a little certificate saying it must reverse. A reading that looks stretched in one environment can keep stretching in another.
For my own work, looking at a MACD or a Z-score on a ticker isn’t enough. I also want to understand the broader market, relevant fundamentals and macroeconomic conditions. Different strategies can use different evidence; this is the research approach I want to build around.
The earlier market-mood dashboard widened the view, bringing economic observations and market measures into a composite. Looking back, I was compressing too much into one summary. It taught me to ask what the composite was hiding. That particular model was retired; the work continued into Regime Analytics.
Now I want to move between the summary and its components: the individual security, its group, market participation and conditions across other asset classes. A single score can be useful without being the only view available. When I talk about more dimensions, I mean more relevant measurements and relationships. I am not proposing a theory about the dimensions of the universe. A model can represent trend, breadth, relative strength and time in a state together. The difficult part is deciding which of those variables carries useful information, how they interact, and when an extra variable merely gives me another way to fit the past.
What the client sees
The interface in these screenshots is deliberately Bloomberg-inspired. Familiar information density and terminal conventions help other quantitative researchers orient themselves. It uses no Bloomberg data. It is a custom client interface, not the design of Regime Analytics itself.
Regime Analytics provides the analytical data through an API; the client dashboard presents it alongside that desk’s other information and tools. We also connect that data to custom AI agents, so the team can receive updates and focus on the parts of the market relevant to their research. Keeping those layers separate lets the research fit the working environment rather than requiring every client to use the same screen.
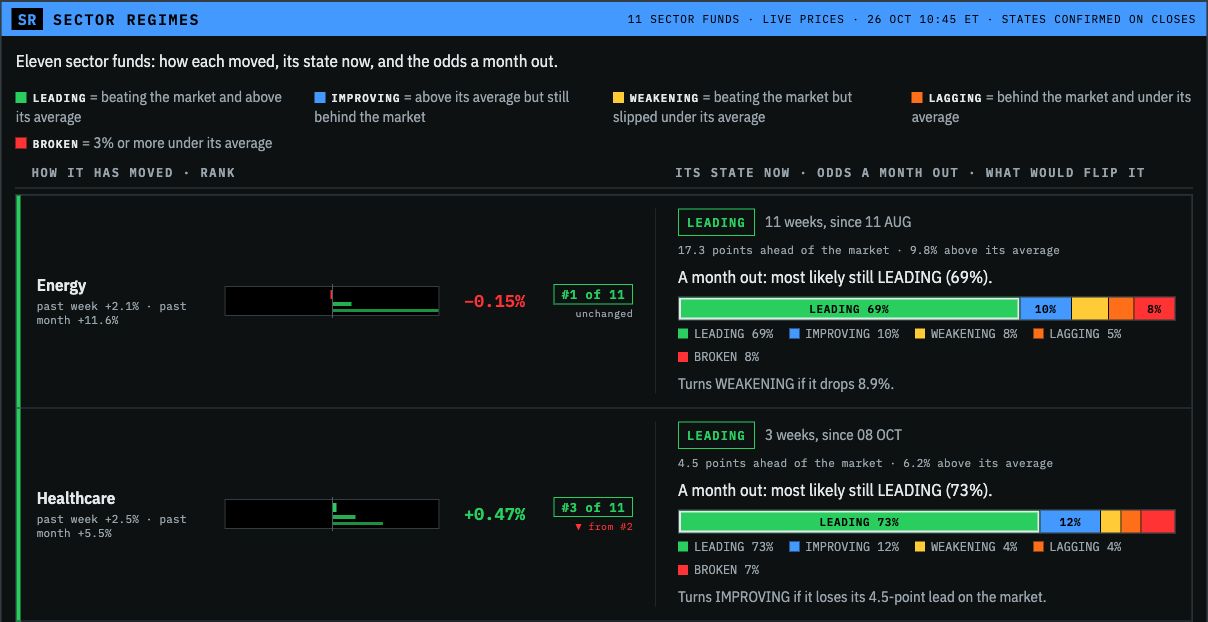
There are several questions a view like this can answer together. Which sectors are leading? Is a sector still above its own trend? How long has it held its current state? What would need to change for the classification to move?
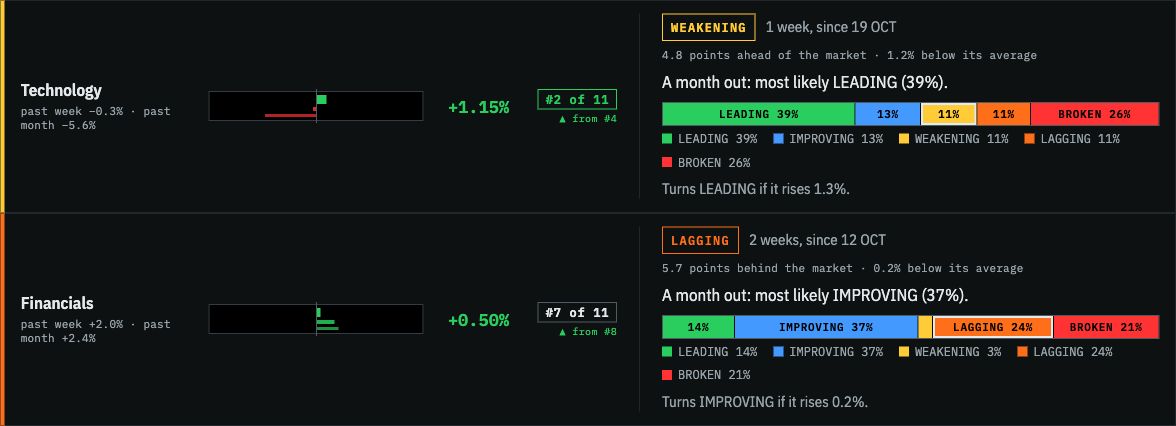
Those are useful distinctions when a screen is full of prices going up and down. On the captured morning, technology was positive on the day while its confirmed state was weakening. It remained ahead of the market over the relative-strength window, but below its own moving average. Financials were also positive that morning, yet classified as lagging. The daily return and the regime label describe different things. Seeing them together gives the researcher more context than either one alone.
Market regime detection under the display
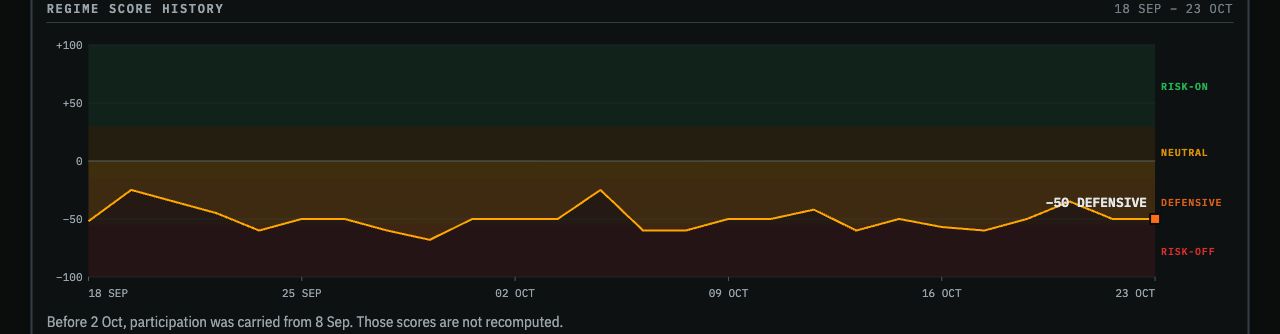
The broad-market framework combines six kinds of evidence: trend, distance above a trailing support level, breadth, participation, sector leadership and weakness across industry groups. Each component is transformed onto a common scale. Weights determine how much each contributes to the combined score:
S(t) = 100 × Σᵢ wᵢ fᵢ(xᵢ(t))
Σᵢ wᵢ = 1;  each transformed component lies between −1 and +1
The resulting score runs from −100 to +100 and maps to risk-on, neutral, defensive or risk-off conditions. These are model-defined categories. They make a set of observations easier to compare over time; they don’t reduce every part of the market to one universal verdict.
Confirmation matters too. The official state uses closing observations and requires persistence beyond a boundary, with a margin, rather than following every intraday fluctuation. The dashboard can show an intraday reading while preserving the last confirmed state. That gives the researcher both the developing picture and the established reference.
At the sector level, two relationships do much of the explanatory work. One compares the asset’s return with the benchmark’s return over the same period. The other compares the asset’s price with its own moving average:
Relative strength = asset return over L sessions − benchmark return over L sessions
Trend             = current price / moving average over M sessions − 1
Being ahead of the benchmark and above the moving average produces a different classification from being ahead of the benchmark but below that average. A further category identifies a sufficiently large break beneath the trend. State changes also require confirmation.
This is why “relative” matters. An asset can fall less than its benchmark and gain relative strength while still losing money. Equally, it can rise and fall behind the benchmark. Relative strength measures comparative performance; it isn’t a direct measurement of investor money flowing in or out.
The framework can also compare conditions across bonds, commodities, cash proxies, currencies and international equities. Those relationships widen the research view beyond US stocks. The interpretation still has to respect what each instrument represents and which benchmark is being used.
Making the research usable
A useful interface should help someone investigate a reading. In the client implementation, a hypothetical-input view lets the researcher change a component and see how the score responds. The official state stays separate from that experiment.
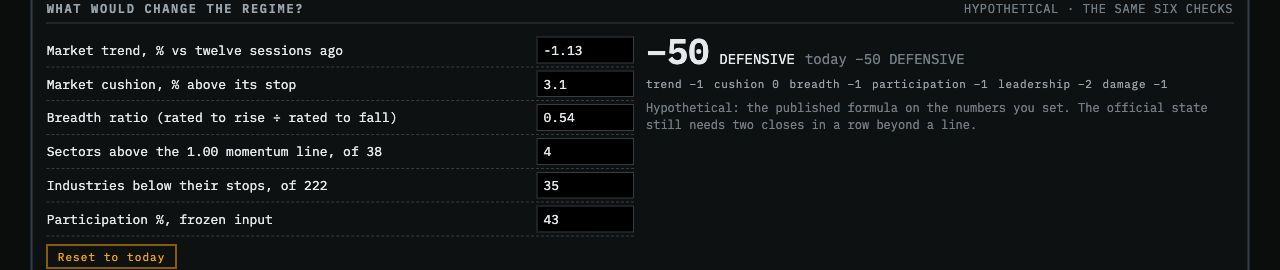
This makes the reasoning inspectable. A researcher can see which observations account for a classification and explore what would alter it. It also keeps a conversation about the market tied to specific inputs rather than two people arguing over what “strong” feels like today.
The API carries the same idea into software. This integration exposes the regime, sector states, dated history and events describing changes. Applications can consume those readings without extracting them from a picture of the dashboard.
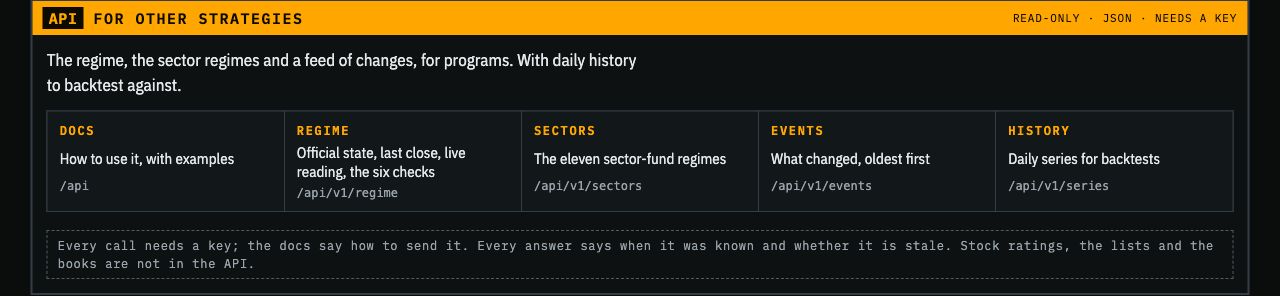
For a client, that creates a practical connection between analysis and workflow. The data can sit beside the information the team already uses. Through the API, we can also bring regime context into machine-learning research and the development of new strategies. The point is to investigate how a strategy behaves under different conditions, rather than assume its overall average tells the whole story.
Three things I keep coming back to
When I talk with my team or give lectures at colleges, I keep returning to three ingredients: original thinking, solid architecture and systems thinking. Original thinking starts with a question worth investigating. You can ask an AI assistant to produce a quantitative strategy, but receiving a plausible strategy is not evidence that you’ve found an edge. It may be a familiar idea, vulnerable to crowding or simply wrong for the conditions you’re testing. I use AI extensively; I still have to bring judgment to the question, the data and the result.
Solid architecture gets the research into a form people can use. Our delivery infrastructure uses Cloudflare. The useful part is that the analytical data can reach a dashboard, an agent or a research process through an API, with its timing and meaning intact. The infrastructure needs to serve the research rather than become a second full-time occupation.
Systems thinking connects the parts. Where does this observation sit? What is it relative to? Which other conditions might change its interpretation? My experience outside finance helps me ask those questions from a different angle.
Those are the foundations I try to work from. Originality alone doesn’t establish alpha, and good engineering doesn’t manufacture it. Together, these habits give me a better way to develop, test and deliver ideas.
The temptation to turn every knob
I like improving things. That is a useful trait right up until I convince myself that one more feature, one more parameter or one more optimization run will finally produce the answer I want. I’ve made that mistake. Tools such as Optuna can help search a parameter space efficiently, but they don’t decide whether I’m asking a sensible question. If I keep returning to the same historical results to choose the next adjustment, I can end up learning those results far too well. This is the test-set leakage problem: the evaluation itself starts influencing the model.
Adding dimensions doesn’t automatically make a prediction better. Sometimes another variable provides information the model was missing. Sometimes it introduces noise, dependence or another opportunity to overfit. AI and machine learning make it easier to explore those possibilities; I still need to establish which changes help on later data.
And sometimes a basic linear model is enough for the specific question. Accepting that takes humility, especially after you’ve spent time building something much more elaborate. The simple model doesn’t owe me an apology for working.
The same restraint applies to the product. I can keep adding features until the screen becomes another problem the client has to solve. More features also mean more maintenance and cost. I want the central questions to stay easy to answer: what conditions are we in, what is changing, and what might that mean for the part of the market I care about?
What the research is testing
The descriptive and predictive parts of this work have different jobs. Current-state classification organizes observations. A forecast estimates a future outcome. The platform can support both; the evidence for a particular forecast has to be attached to that particular forecast.
For example, an October sector-state study reported roughly 50% accuracy for the most likely state one month ahead, compared with about 46% for simply assuming the state would stay the same. Always choosing the most common state gave about 39%. The useful comparison is the improvement over those simple alternatives, rather than an attention-grabbing comparison with random guessing.
That study used 1,374 month-apart observations pooled across sector funds from 2016 onward, with the initial fitting period before 2016. Several probability models were compared on the later period, so that period also informed the choice of model. A fresh forward evaluation is the next way to judge the selected version. Those percentages describe state classification, not investment returns, and they don’t summarize every capability of Regime Analytics.
The weekend research asked other questions using a separate historical regime reconstruction. One candidate linked emerging markets entering a lagging state with a subsequent change in the US regime: 36 of 46 events in the earlier period and 16 of 22 in the later period, versus background rates of about 59% and 62% respectively. There were 204 candidate lines in that search. Twenty-two later-period events are a small sample, and the outcome was a regime change in either direction. I regard that as a relationship to investigate prospectively, rather than turning “73%” into a promise about the next trade.
Some questions produced much less useful results. The broad score’s relationship with subsequent drawdown was appreciably weaker in the later period of one test. A pre-market breadth study did not establish a useful incremental directional signal after accounting for the opening gap. Those are findings about particular formulations and samples. They tell me where more work is needed and which claims the evidence can support. This is part of developing a research product: keep the useful structure, test the predictive additions and distinguish a promising result from a capability established in use. A reconstructed history is valuable for investigation, but it is not ten years of live client performance.
Where the boxes connect
Hurricane Milton destroyed my parents’ old pool pump in October 2024. I rebuilt the pump setup myself, from preparing the foundation to putting the equipment and plumbing together. This was the pool project in Ocala that kept finding its way into my thinking about markets.
Working on it, I found myself thinking about water moving through the pipes, the variable-speed pump and how the pieces affected the system’s efficiency. A pump’s job depends on what the system needs: even the required flow differs between functions such as filtration and cleaning, as ENERGY STAR explains. Turning it up isn’t the same thing as optimizing it.



That sort of thing gets my brain going. So do the clouds moving past my patio and the traffic congestion in Miami. I start thinking about flow, constraints, timing and what happens when one part changes. I don’t transfer a plumbing equation into a trading model and declare the problem solved. I bring back a question I might not have asked while staring at a ticker.
Regime Analytics has grown through that process: ideas from elsewhere, market data, tests, revisions, and the practical demands of people using the work. The client gets a way to follow conditions across the market, examine the relationships underneath them and bring that context into its own research and decisions. I want to keep making that clearer and more useful. Preferably without adding another twelve panels to the dashboard. I already have Miami traffic to overthink.
Explore Regime Analytics or get in touch about research and custom integrations.
Research and product discussion; not investment advice. Screenshots are dated examples of a custom client implementation.